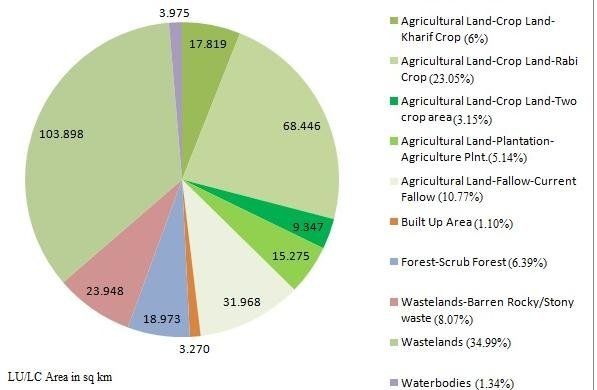
This graph shows how the water that is given is used. It comes in the form of a pie chart so each use can be shown.